
Vertical analysis is an accounting method that helps compare different parts of financial documents, like financial statements. In vertical analysis, each line item in a financial statement is shown as a percentage of another item. This makes it easier to understand the proportions within the statement. This technique is often used alongside horizontal analysis.
When is Vertical Analysis Used?
Vertical analysis is a type of ratio analysis that shows each line in financial statements as a percentage of another specified item. This method sets a standard for easy comparison. For example, in an income statement, if the base is revenue, each item is shown as a percentage of the revenue. The base could also be net income or total gross income. In a balance sheet, the base might be total assets, liabilities, or equity.
This approach helps quickly identify relationships by showing how different account balances compare. Vertical analysis also makes it easier to compare different companies in the same industry. By using percentages instead of absolute values, it allows for fair comparisons of companies with different levels of sales or assets. Analysts can see how businesses of different sizes manage their assets, liabilities, income, expenses, and cash flow.
Importance of Vertical Analysis
Vertical analysis helps stakeholders by comparing different accounts, providing a clear picture of financial health. Tracking ratios over time enables organizations to monitor changes and improve decision-making. It also aids in benchmarking performance against industry standards.
Vertical analysis is important for several reasons:
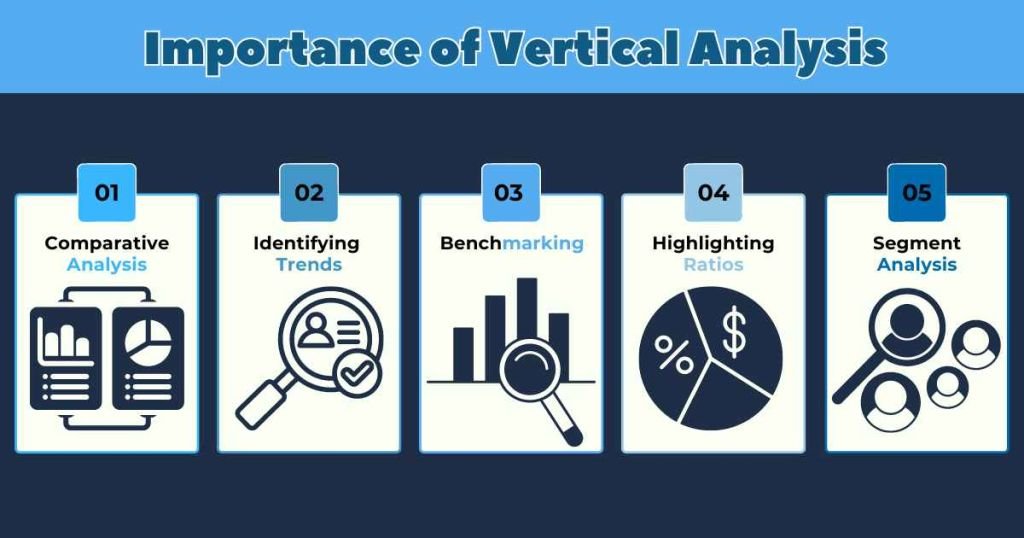
1. Comparative Analysis
Vertical analysis simplifies the comparison of different line items in financial statements by expressing each item as a percentage of a base figure (e.g., total sales or total assets). This approach helps identify trends and assess the relative proportions of expenses, assets, and liabilities.
2. Identifying Trends
Vertical analysis detects trends over time within a company’s financial statements. By analyzing how each line item changes as a percentage of the base figure across different periods, stakeholders can observe increases or decreases in expenses, revenues, and other key metrics.
3. Benchmarking
It supports benchmarking against industry standards or competitors. Comparing the vertical analysis of different companies within the same industry provides insights into how a company’s cost structure or financial performance compares to its peers.
4. Highlighting Ratios
Vertical analysis aids in calculating and understanding key financial ratios such as gross profit margin, operating profit margin, and net profit margin. These ratios, derived from vertical analysis, offer critical insights into profitability and operational efficiency.
5. Segment Analysis
Vertical analysis can be applied to evaluate the performance and profitability of specific segments within a company’s operations or across different divisions. This analysis helps stakeholders understand each segment’s contribution to the company’s overall financial structure.
Differences between Vertical Analysis and Horizontal Analysis
Horizontal analysis and vertical analysis are two important methods for examining financial statements. The main difference lies in their perspective:
Horizontal Analysis
Horizontal analysis looks at changes over time by comparing financial data across different periods. This helps see if numbers like revenue are increasing or decreasing from year to year. It also checks how specific items or financial ratios have changed over time, such as every three months or every year.
This is important for understanding if profits are growing, finding out when sales change, and seeing how well financial plans work over time. When used with vertical analysis, which looks at how parts of financial statements relate to each other, businesses can see their overall financial health clearly. This helps make smart choices for the future and for growing the business.
Vertical Analysis
Vertical analysis examines relationships within a single period by comparing various items on a financial statement to a base number, typically expressing each item as a percentage. This method offers insights into the composition and proportion of different accounts relative to a whole.
For instance, it can illustrate the percentage of total revenue that each expense category represents, helping businesses understand their cost structure and financial priorities in relation to overall revenue. This analysis aids in pinpointing significant areas of expenditure or revenue generation within the financial framework of an organization.
Both analyses offer valuable yet distinct insights. Horizontal analysis reveals whether your financial situation is improving or worsening over time. Vertical analysis provides a view of how different parts of your finances stack up and relate to each other. When used together, they create a strong approach for understanding financial statements.
How to Apply Vertical Analysis
When doing vertical analysis, analysts look at each part of the financial statement on its own, without comparing them directly to each other. For example, they don’t usually look at income statement items as a percentage of gross income. However, sometimes it makes sense to compare certain ratios, like showing liabilities as a percentage of net income.
When preparing vertical analysis, the ratios are often shown in a column to the right of the financial statement values. This way, you see each item as a percentage of total sales next to the actual numbers. While financial statements are sometimes presented this way, FP&A analysts often adjust their approach depending on what information they need. Although people may use different methods to analyze and compare financial statements, this column presentation is a common approach.
Pros and Cons of Vertical Analysis
Pros:
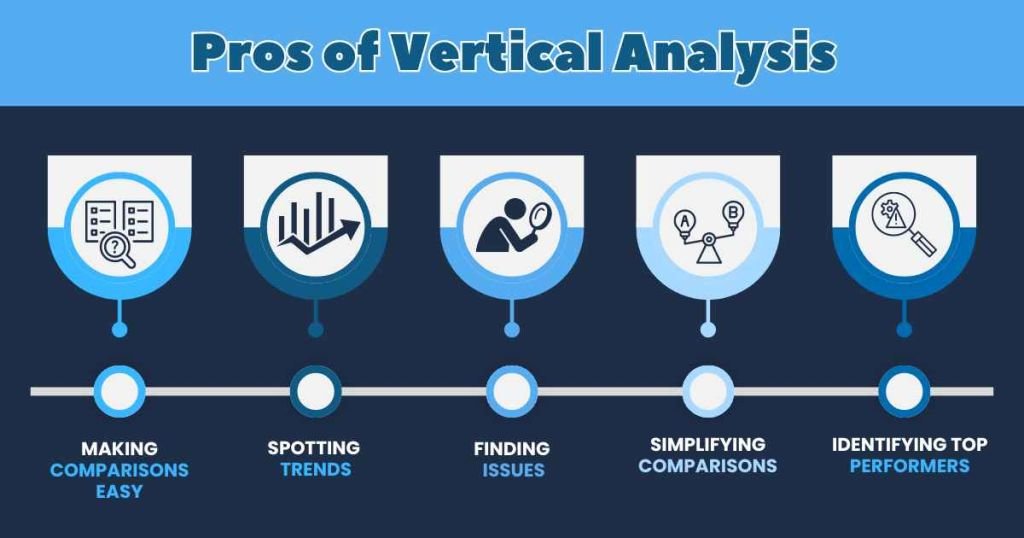
- Making Comparisons Easy: Vertical analysis allows you to directly compare the size of different financial items over time.
- Spotting Trends: It helps identify important trends, such as changes in sales growth or declines.
- Finding Issues: This method can reveal problems like costs growing faster than revenue.
- Simplifying Comparisons: It makes it easy to quickly and accurately compare different parts of the organization by showing each segment’s expenses as a percentage of total sales.
- Identifying Top Performers: It helps find the best-performing segments, which aids managers in making better decisions.
Cons:
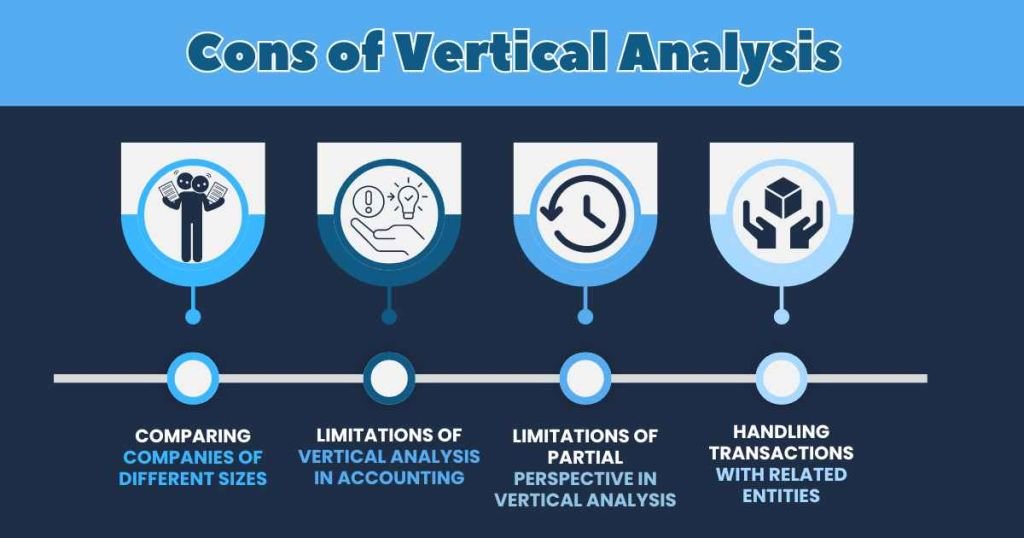
- Comparing Companies of Different Sizes: It cannot show the exact size of different items, which might make it easy to compare companies that are different sizes in a way that is not accurate.
- Limitations of Vertical Analysis in Accounting: Vertical analysis focuses solely on internal factors within financial statements and doesn’t account for external influences like inflation, which can affect year-to-year changes in numbers.
- Limitations of Partial Perspective in Vertical Analysis: This method doesn’t give a complete view of how well a company is doing overall because it only looks at individual parts and how they compare to each other on the financial statement.
- Handling Transactions with Related Entities: Transactions involving related entities, like subsidiaries, are often left out of calculations because accounting for them can be complex.
Final Thoughts
Vertical analysis is a useful accounting method that compares each item on financial statements as a percentage of another specified item. This helps stakeholders understand a company’s financial health by showing how different parts relate to a whole. It’s good for spotting trends and comparing segments, but it has limits—it doesn’t give exact values and ignores outside factors. To get a full view, businesses often use both vertical and horizontal analyses together. These tools are key for smart financial decisions and understanding where a company stands compared to others.
FAQs
What is vertical analysis?
Vertical analysis lists each item on a financial statement as a percentage of another item. For example, in an income statement, it shows each line item as a percentage of total sales.
Why is vertical analysis important?
Vertical analysis helps in understanding the relative proportions of various accounts. It simplifies comparison across periods and with other companies, revealing trends and making it easier to identify strengths and weaknesses in a company’s financial structure.
How do you perform vertical analysis?
To perform vertical analysis, divide each line item on the financial statement by a base figure and multiply by 100. In the income statement, the base figure is typically total sales. In the balance sheet, it’s usually total assets.
What are the benefits of vertical analysis?
Vertical analysis provides a clear picture of cost structure and profitability. It highlights significant changes in expenses and revenues over time and aids in benchmarking against industry standards or competitors. This helps in making informed financial decisions.