
It’s important to become proficient in using Excel for financial analysis. Excel provides powerful tools that help analyze and understand financial data more effectively. Investors utilize Excel for technical calculations and accounting ratios, while corporations analyze budgets, risks, and cash flows. Options traders use it for pricing, and Excel offers a range of financial analysis models.
How to Understand Excel-Based Financial Analysis
Financial modeling involves creating a mathematical representation of a company’s finances. It requires analyzing past data, predicting future performance, and understanding how different factors impact finances. Excel facilitates this with its extensive tools.
Begin by mastering basic formulas like SUM, AVERAGE, and IF, which are important for calculating totals, averages, and making conditional decisions. Progress to advanced functions such as VLOOKUP and INDEX-MATCH for finding data across different areas.
Excel’s Tools and Functions Proficiency for Financial Analysis
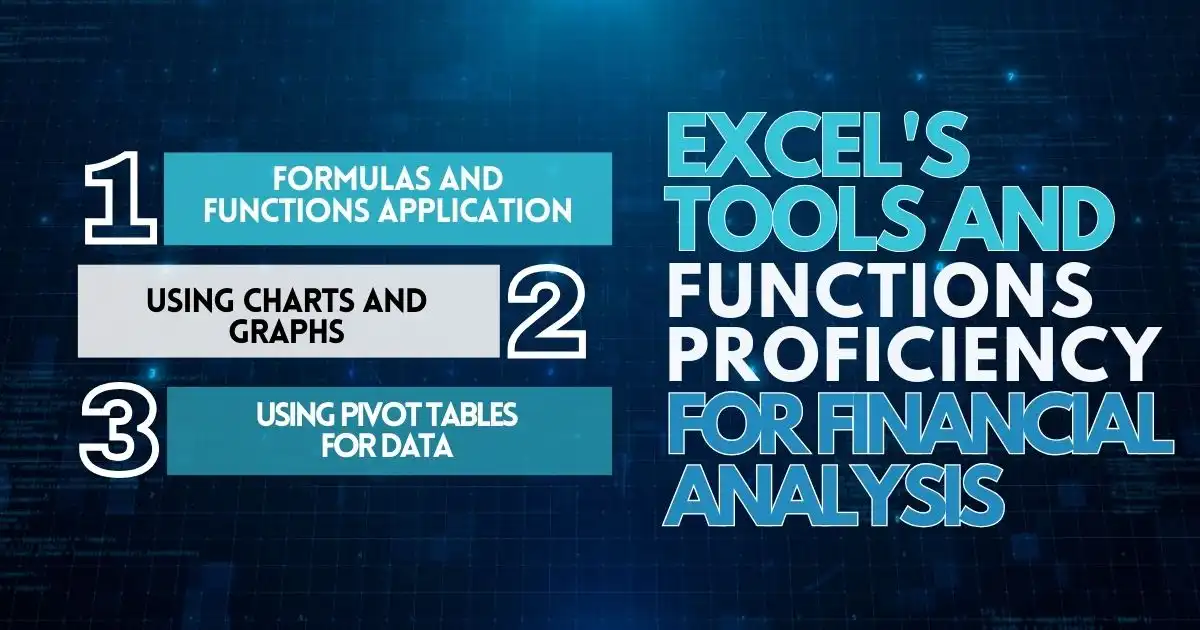
1. Formulas and Functions Application
Excel’s formulas and functions are essential for financial analysis. These tools help process large datasets efficiently and make informed decisions. For instance, simple formulas like SUM, AVERAGE, and COUNT help calculate total earnings, average growth, and the number of transactions. Advanced functions like IF, VLOOKUP, and HLOOKUP perform complex calculations and locate specific data in your dataset.
2. Using Charts and Graphs
Excel enables the creation of charts and graphs to present findings in a straightforward manner. By utilizing different chart types, adding labels, and adjusting colors, you can effectively convey trends and patterns in your data.
3. Using Pivot Tables for Data
PivotTables are invaluable for simplifying large datasets, and helping identify key patterns and trends with ease. For example, you can create a table to display total sales across various product categories over a given timeframe, revealing top-selling categories and enabling future trend predictions.
Data Clean-Up Using Excel
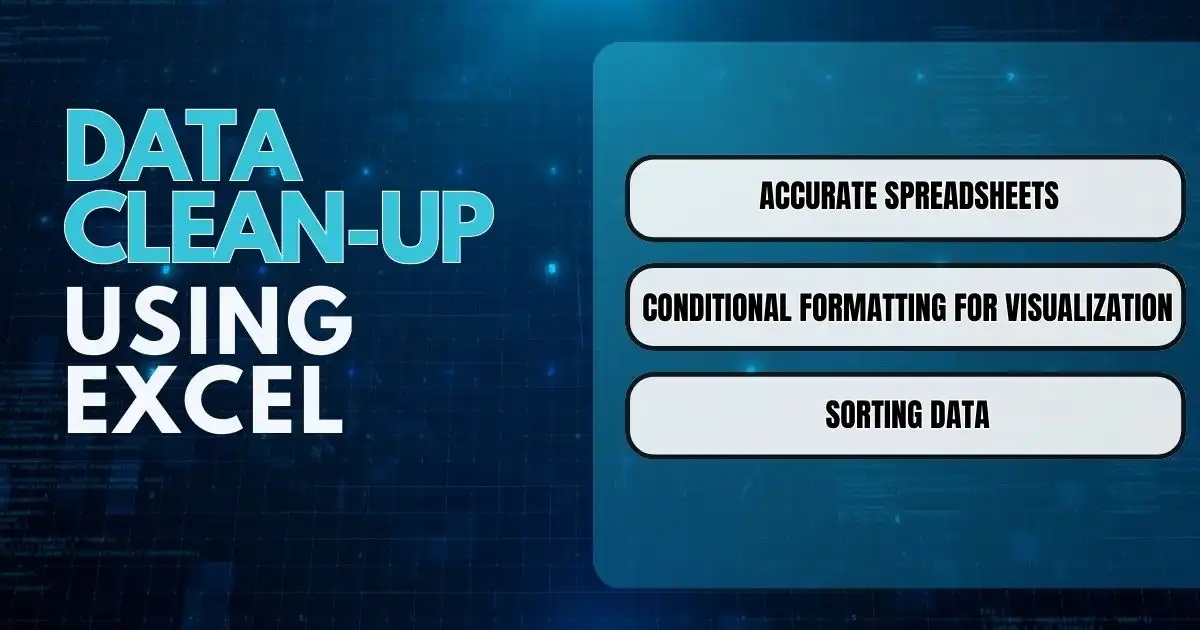
Effective financial data analysis requires creating well-organized spreadsheets in Excel. Consistent styling, clear labeling of rows and columns, and neat formatting are key. Conditional formatting can also highlight critical information while sorting and filtering make it easier to focus on specific data segments.
1. Accurate Spreadsheets
Neat and readable spreadsheets are important for financial analysis. Use clear fonts, colors, and cell alignment to keep your data organized. Additionally, data validation ensures accuracy and prevents errors.
2. Conditional Formatting for Visualization
Excel’s conditional formatting enhances the visibility of trends and significant data points. For example, using color scales to indicate value differences or icons to represent specific conditions simplifies data interpretation.
3. Sorting Data
Sorting and filtering techniques in Excel help uncover patterns in data. Utilizing advanced filters, multiple filters, and sorting options enables a more detailed analysis of financial trends.
Using Excel for Financial Ratio Analysis
Financial ratio analysis in Excel provides a comprehensive evaluation of a company’s performance. With Excel’s built-in functions, you can quickly calculate profitability, liquidity, and solvency ratios by inputting data from financial statements. Comparing a company’s ratios with industry peers using functions like AVERAGE and STDEV offers a broader performance perspective.
Conducting and Presenting Financial Analysis Results with Excel
When presenting financial analysis, it is essential to display ratios neatly. One effective method is through tables in Excel.
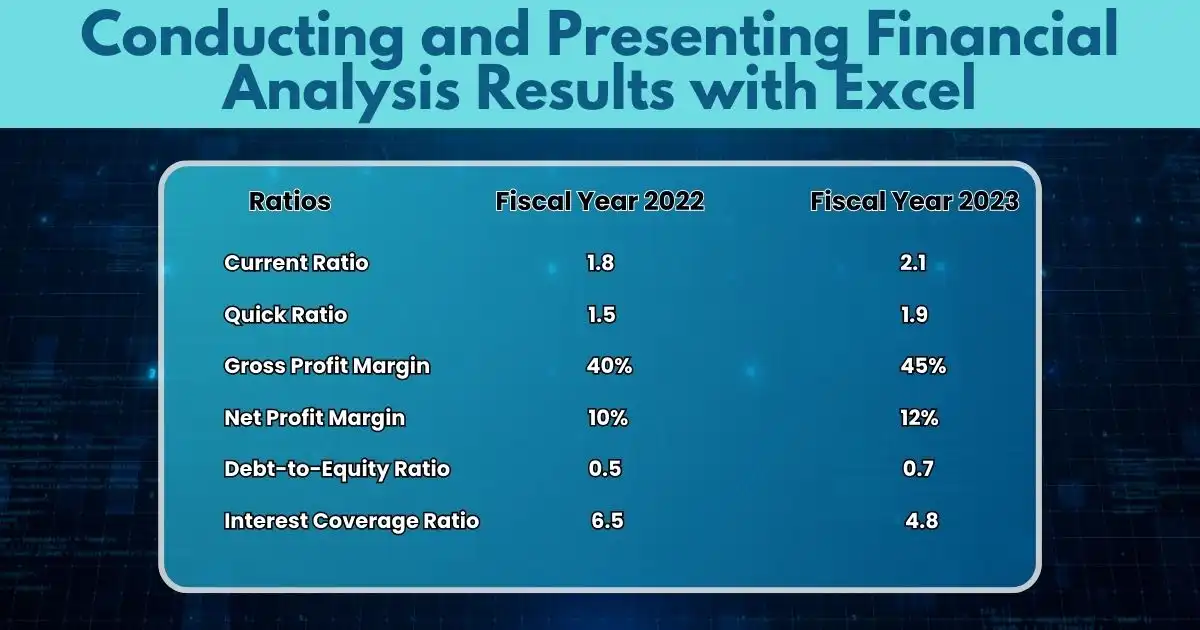
By using tables like the one above, trends and patterns become more apparent. Combining tables with charts or graphs further simplifies complex information, allowing for an effective presentation of a company’s financial status.
5 Key Benefits of Using Excel for Financial Analysis

1. Easily to Use
Excel is user-friendly, requiring only basic computer skills to create, read, and edit spreadsheets, making it accessible even to those without a financial background.
2. Automation and Efficiency
With features like Macros, Excel can automate repetitive tasks and complex calculations, saving time and reducing the likelihood of errors. This streamlines the financial analysis process, allowing for quicker and more accurate decision-making.
3. Arrange and Condense Information
Excel’s PivotTable feature effectively organizes large datasets, offering financial insights like averages, deviations, and percentage changes.
4. Futuristic Forecasts
Excel’s forecasting tools, such as Power Pivot, allow for accurate real-time predictions by incorporating various datasets and assumptions.
Excel’s forecasting capabilities include tools like FORECAST.ETS and data tables for scenario analysis, provide insights into potential future performance. This is invaluable for budgeting, cash flow analysis, and strategic planning.
5. Collaboration and Data Sharing
Excel facilitates teamwork by enabling data sharing and collaboration on financial analysis, helping departments make well-informed financial decisions together.
Excel with Excel!
Microsoft Excel is indispensable for financial analysis, from cash flow forecasting to advanced data analysis methods like Monte Carlo simulations and regression analysis. Its features streamline the creation of reports and enhance data interpretation, enabling accurate comparisons and predictions.
Learning Excel for financial analysis can save your company time and resources, improve forecasting accuracy, and support more informed decision-making.
The future of Excel in financial analysis remains strong, as it continues to evolve with more advanced data analytics, automation, and integration features. With ongoing enhancements such as Power Query, and Power Pivot, and new AI-driven capabilities like Excel’s Analyze Data tool, it is becoming increasingly powerful for handling complex financial modeling and large datasets.
While more specialized software and cloud-based analytics tools are emerging, Excel’s flexibility, accessibility, and widespread use ensure it will continue to be a cornerstone for financial professionals, complementing newer technologies and adapting to changing business needs.
FAQs
How to use Excel in financial analysis?
To use Excel for financial analysis, start by organizing your financial data into spreadsheets. You can input your company’s income, expenses, and other financial details in rows and columns. Excel’s built-in tools like tables, graphs, and pivot tables help you track, sort, and analyze the data, making it easier to understand your financial situation.
What Excel formulas do financial analysts use?
Financial analysts commonly use Excel formulas like SUM to add numbers, AVERAGE to find averages, and IF to perform logical tests. VLOOKUP helps retrieve data from tables, while NPV and IRR calculate the value and profitability of investments, respectively. These essential formulas simplify financial analysis and decision-making.
How to prepare financials in Excel?
To prepare financials in Excel, start by entering your financial data, such as revenues, expenses, assets, and liabilities. Next, use formulas to calculate totals, averages, and key financial ratios. Once the data is in place, create financial statements like income statements, balance sheets, and cash flow statements by formatting the information clearly and logically.
How do you do an analysis on Excel?
To perform an analysis in Excel, first gather and input the data you need to analyze, such as sales figures or cost data. Then, use formulas like SUM, AVERAGE, and PERCENTAGE to calculate important figures. You can also create charts or graphs to visualize the trends and patterns. Pivot tables are useful for summarizing and analyzing large sets of data quickly and efficiently.