
Modern businesses operate at high speed, demanding quick and confident decisions. Finance teams handle vast amounts of data daily, making it essential to use this information effectively. Key tasks like performance tracking, budget planning, and trend analysis rely on accurate, real-time insights.
Power BI, Microsoft’s business intelligence platform, helps by turning raw data into clear, interactive reports. With dashboards featuring charts, graphs, and tables, finance teams can easily visualize trends, identify issues, and share insights across the organization.
What new opportunities emerge when finance stops chasing numbers and starts leading with real-time insight?
What Is Power BI?

Power BI is a powerful business intelligence tool that allows users to transform raw data into meaningful visual reports and dashboards. It was designed to make complex data easier to understand by using visuals instead of just numbers and text.
With Power BI, users can take information from different sources—like Excel files, databases, or cloud services—and bring it all together in one place.
The dashboards created in Power BI are built to help people see patterns, compare figures, and make decisions quickly. Charts, tables, graphs, and even maps can be added to show the data in a way that is simple and clear. Because of this, users do not need to be data experts to understand what the numbers mean.
The goal of Power BI is to help everyone in a company—especially in finance—make smart decisions by looking at easy-to-read visuals.
Why Finance Teams Use Power BI

Finance teams handle large amounts of data every day, and using the right tools can make their work faster, easier, and more accurate. Power BI has become a popular choice because it offers many helpful features designed to support financial tasks and decision-making.
Better Understanding of Financial Data
Financial data can be hard to read in Excel sheets. But with Power BI, this data is shown in colorful visuals. Because of this, numbers are easier to understand. For example, instead of looking at a list of numbers, a bar graph can be used to show income growth over time.
Real-Time Data Can Be Used
With Power BI, data from different sources can be connected. As a result, dashboards can automatically display the most recent data. This means reports do not have to be updated by hand. Finance teams can always see the latest numbers.
Reports Can Be Shared Easily
Dashboards made in Power BI can be shared online. Anyone with access can view the same report. This makes teamwork faster and simpler. The same numbers can be viewed simultaneously by everyone.
Examples of Power BI Dashboards in Finance
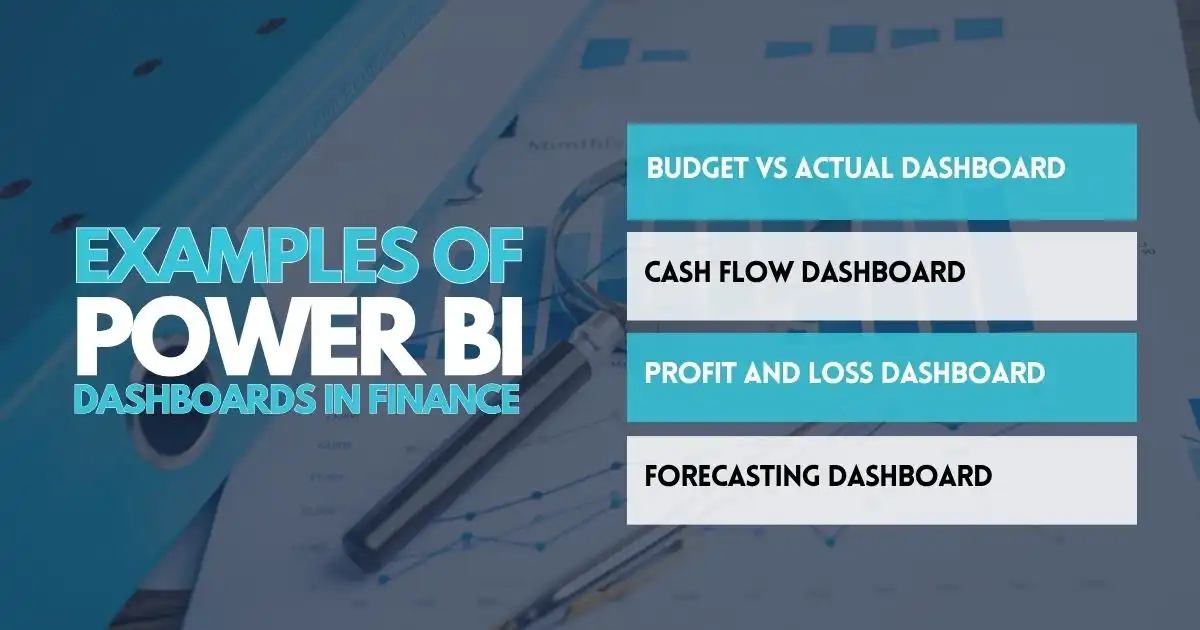
There are many types of Power BI dashboards that finance teams can use to monitor performance, manage money, and support better decision-making.
- Budget vs Actual Dashboard – This dashboard compares the planned budget with actual spending. If spending is higher than expected, the problem is shown clearly. Managers can take quick action.
- Cash Flow Dashboard – A cash flow dashboard shows money coming in and going out. It helps finance teams check if the business has enough cash to keep operating smoothly.
- Profit and Loss Dashboard – Income, expenses, and profit are shown in this dashboard. Monthly or quarterly performance can be tracked. If profits are falling, reasons can be found quickly.
- Forecasting Dashboard – Power BI can be used to make future predictions based on past data. These forecasts help leaders plan for growth or prepare for risk.
Benefits of Using Power BI for Finance

Power BI helps finance teams understand data quickly and clearly. It makes it easier to track budgets, spot problems, and make smart decisions.
- Time is saved – Reports are made faster than with manual Excel sheets.
- Mistakes are reduced – Automation helps avoid typing errors.
- Insights are improved – Data is easier to explore and understand.
- Decisions are made faster – Because trends are seen quickly.
Getting Started with Power BI

To begin using Power BI in finance:
- Data should be prepared – Excel files, databases, or cloud data can be used.
- Power BI Desktop should be installed – This is free software for making dashboards.
- Dashboards can be created – Visuals are added based on your financial goals.
- Reports should be published – After publishing, they can be shared online with your team.
Unlocking Financial Clarity with Power BI
Power BI isn’t just another software—it’s a secret weapon for finance teams. Instead of drowning in spreadsheets and chasing numbers, teams can now turn raw data into smart, colorful dashboards that speak louder than words.
What once took hours can now be done in minutes, with reports updating in real time—no more guesswork, just clear answers. It’s like turning on the headlights while driving at night—you see where you’re going and what’s ahead.
With better visuals, sharp insights, and easy sharing, financial data becomes a tool for action, not just something to store. Whether you’re budgeting, tracking goals, or planning. Power BI gives you the confidence to lead, not follow. In today’s data race, falling behind isn’t an option.
So why wait in the slow lane when Power BI can put you in the driver’s seat? Your numbers are talking—Power BI helps you finally hear what they’re saying.
FAQs
What is Power BI for financial reporting used for?
Power BI for financial reporting is used to create dynamic, visual reports that help finance teams track performance and share insights easily. In other words, it transforms raw data into clear visuals that support smarter financial decisions.
Why is financial data visualization important?
Moreover, financial data visualization turns complex numbers into charts and graphs, making it easier to understand trends and make informed choices.
What are real-time financial dashboards in Power BI?
In addition, real-time financial dashboards in Power BI automatically update with live data, allowing users to monitor important metrics instantly.
Why is budget vs actual analysis important in finance?
Budget vs actual analysis helps businesses see where spending differs from the plan so they can adjust strategies quickly.