
Do you find yourself staring at your company’s income statement, unsure of what the numbers really mean?
Many business owners face this same challenge. The income statement isn’t just a list of figures; it’s a key indicator of how your business is performing, from revenue to expenses. Taking the time to analyze it can give you a clearer picture of your company’s financial standing.
What is the Purpose of an Income Statement?
An income statement shows a business’s financial details, including how much money it made and spent over a specific period. Accountants create these statements by comparing financial records from two different times.
By reviewing an income statement, you can figure out:
- If the business is making a profit.
- If it’s spending more than it’s earning.
- When expenses are highest or lowest.
- How much it cost to make its products?
- If it has enough money to reinvest in the business.
Accountants, investors, and business owners often look at income statements to see if a business is reaching its goals. They use this information to make changes.
For example, if a company isn’t meeting its targets, the owner may adjust their strategy to improve in the next quarter. Similarly, an investor might decide to sell their shares and invest in a company that’s performing better.
Understanding the Income Statement
An income statement is an important document for both a company’s management and investors. It gives a clear view of a company’s income and expenses over a specific time, helping to show how well the business is doing financially.
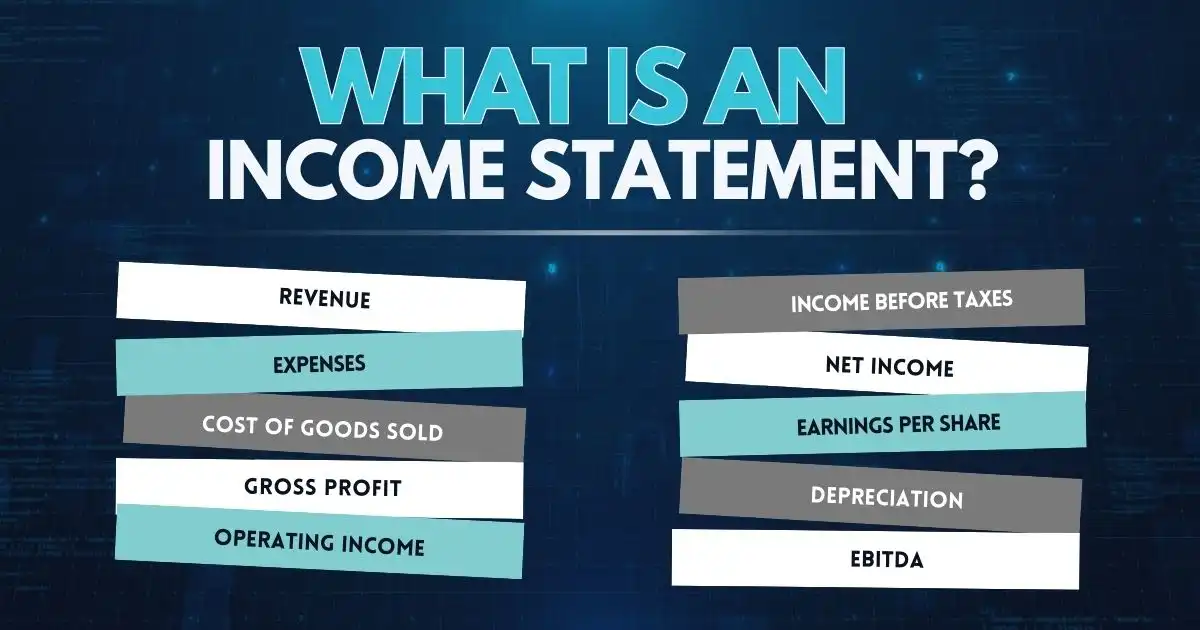
The main parts of an income statement include:
- Revenue: The total money the business earned during the period.
- Expenses: The total money the business spent during the same period.
- Cost of Goods Sold (COGS): The cost of the materials or parts used to create the products or services sold.
- Gross Profit: Revenue minus COGS.
- Operating Income: Gross profit minus operating expenses.
- Income Before Taxes: Operating income minus any non-operating expenses.
- Net Income: Income before taxes minus taxes.
- Earnings per Share (EPS): The company’s profit is divided by the total number of shares people own.
- Depreciation: The decrease in value of assets, such as equipment, over time.
- EBITDA (Earnings Before Interest, Taxes, Depreciation, and Amortization): A measure of a company’s cash flow, calculated by adding back interest, taxes, depreciation, and amortization to net profit.
Some companies may break down these sections into more specific items, like dividing revenue by product line or listing out different types of expenses, such as wages, rent, and interest payments.
Income Statement Analysis

There are two common methods for reviewing a company’s financial data: vertical analysis and horizontal analysis.
1. Vertical Analysis
Vertical analysis looks at each item on a financial statement as a percentage of a base amount, like total sales. Instead of focusing on the dollar amounts, it shows the proportion of each item concerning total sales. For example, it might express each expense as a percentage of operating costs.
This method makes it easier to compare financial statements over time or across companies because it highlights the relative size of each item. It helps you see certain performance metrics are improving and can point to questions like: Where did costs go up or down? What items are affecting profit margins the most?
While vertical analysis might not provide immediate answers, it helps guide important questions and allows for better comparisons.
2. Horizontal Analysis
Horizontal analysis compares changes in financial figures over multiple reporting periods, showing how amounts have increased or decreased over time. This analysis can be shown in both dollar amounts and percentages.
This method helps track a company’s growth and trends over time, making it easier to spot patterns and measure consistency. It’s also useful for comparing a company’s financial performance with its competitors.
Investors and analysts use horizontal analysis to see what has impacted the company’s performance over the years, like comparing one quarter’s results to another. In short, horizontal analysis helps you see trends and changes over time instead of just looking at individual items on their own.
Apple Inc. Income Statement
Here’s an example of an income statement for Apple Inc. for the year ended December 31, 2023.
This income statement shows:
- Apple Inc. generated $405.75 billion in sales while incurring approximately $220.00 billion in costs, resulting in a gross profit of $185.75 billion.
- After deducting $22.50 billion in selling and operating expenses, and $23.00 billion in general and administrative expenses, Apple reported an operating income of $140.25 billion.
- The operating income was adjusted for additional gains and losses, including $20.50 billion paid in income taxes.
- By the end of the fiscal year, Apple Inc. reported a net income of $103.75 billion.
A Clear Path to Smarter Decisions
Reviewing an income statement gives you a clear picture of your company’s financial health, helping you understand where the money is going, how expenses are managed, and how well the business is performing overall.
Breaking down revenues, costs, and profits, the income statement reveals key insights into what’s driving your company’s success—or where adjustments need to be made. But the real question is, are you using this information to make smarter decisions for the future?
FAQs
How to do the analysis of the income statement?
To analyze an income statement, review revenue, expenses, and profit. Compare costs against revenue and use ratios like gross or net profit margin. Use vertical analysis (percentages of revenue) and horizontal analysis (changes over time) to spot trends.
Why is it important to analyze the income statement?
Analyzing the income statement shows if a company is profitable, helps manage costs, and identifies growth trends, aiding in smarter decision-making.
What is the interpretation of the income statement?
Interpreting an income statement means understanding how revenue, costs, and expenses impact profit, showing the financial health of a company.
How do you explain an income statement?
An income statement summarizes revenue, expenses, and profit over a period, showing if a company is making or losing money.