
Financial dashboards are now important for businesses. Moreover, they help leaders see important numbers, track how well the business is doing, and make smart decisions based on data. A good financial dashboard gives quick insights, makes reporting easier, and helps improve financial results. Implementing these tips to create effective financial dashboards could greatly benefit your company.
According to recent surveys, over 70% of organizations use financial dashboards to visualize data and track performance. However, these dashboards are valued for their ability to simplify complex financial information and facilitate strategic planning across departments.
Importance of Financial Dashboards
Financial dashboards are important for businesses because they show important data in a clear and organized way. They give real-time updates, helping track performance and respond quickly to problems. With all the information in one place, businesses can make smart decisions, spot trends, and plan well.
Dashboards make reporting easier, save time, and reduce mistakes, improving efficiency. They also make it easier to understand and share data, improving communication. In addition, dashboards help set and track goals, monitor performance, and keep people accountable. They can be customized for different needs and are key to keeping businesses competitive and financially healthy.
5 Tips to Develop High-Impact Financial Dashboards
If you want to create a financial dashboard for your organization, here are some essential guidelines to follow:
1. Know What Your Users Need
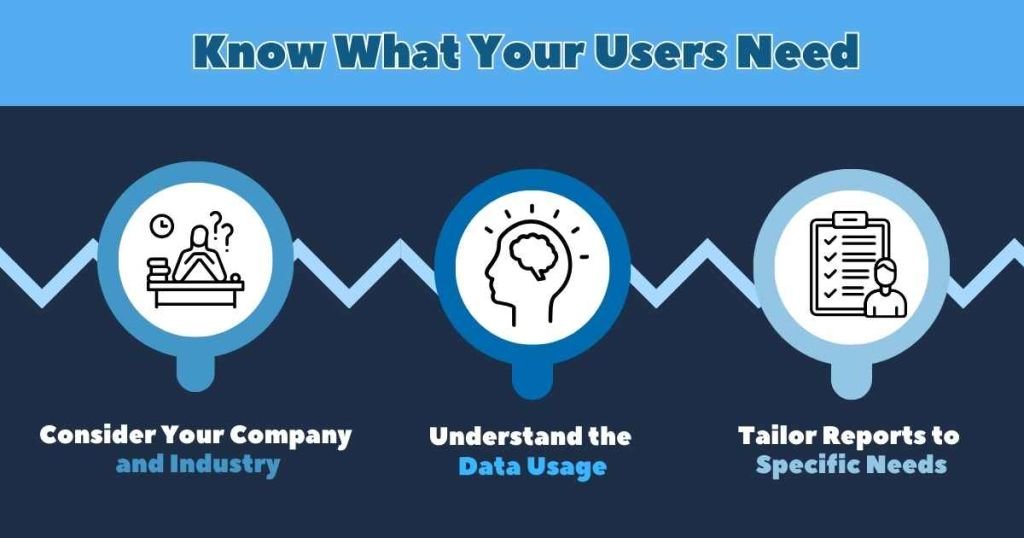
Before you start making reports, think about your company, the industry it’s in, and what your audience needs. To make a good financial report, it’s important to understand how the data will be used. Different parts of your company might need different information, like where your money comes from, what costs the most, and what resources are most important.
Tailoring reports to meet these exact needs makes sure they are helpful and fitting. Moreover, this method connects financial reports with the organization’s main goals and aids in making well-informed decisions throughout the company.
2. Prevent Confusion Among Your Audience
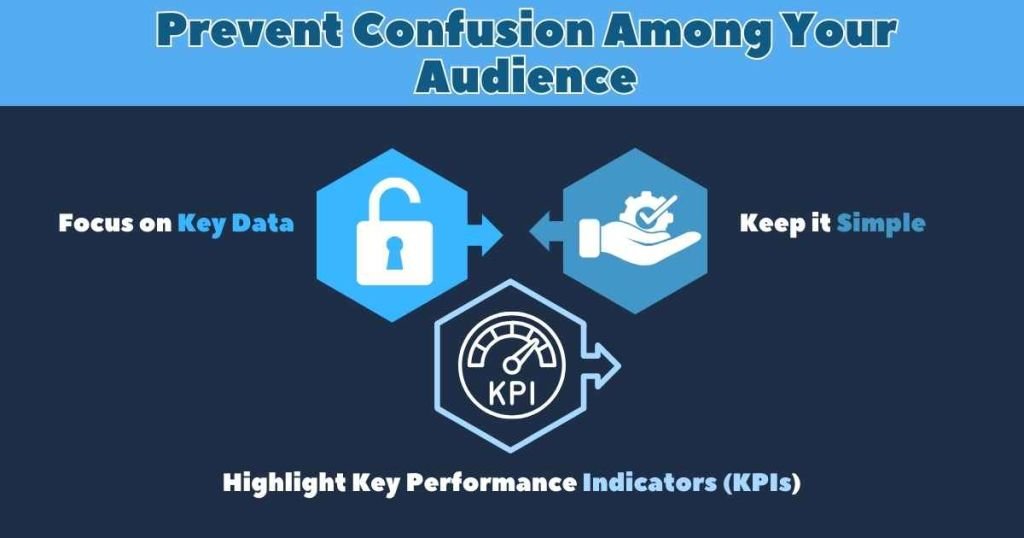
When building a financial dashboard, the main danger is having too much data. To avoid this, concentrate on the most important information you have when creating the report. Highlight Key Performance Indicators (KPIs) to give essential insights without confusing your audience.
It’s important to keep things simple for clear communication and decision-making. A dashboard that presents clear and relevant data in a straightforward way is more effective than one with too much information.
3. Select The Right Key Performance Indicators (KPIs)
Decide why you’re reporting finances—is it for projects, analyzing company activities, or showing key numbers at a certain time? Use visual tools to make charts and interactive dashboards that let people easily explore big amounts of data.
When presenting, tell stories with data to explain why numbers change. Each key number should clearly show how well the company is doing.
4. Consistent Updates are Essential
View your financial report as a living document that evolves with your decisions. Furthermore, regularly update your dashboard to reflect changes in the world, project statuses, goals, and financial limits.
This active maintenance ensures your dashboard aligns with decision-making, making it a valuable tool for monitoring your company’s performance in real time.
5. Single Indicator Display on Each Screen
When you make presentations, focus on being clear and simple rather than complicated. Too many numbers, charts, or pictures on one slide can confuse people and make it hard to understand. Instead, try to share just one main idea on each slide. This helps people grasp information quickly and make decisions faster.
Simplify for those unfamiliar with complex layouts or technical details. Moreover, use bullet points, short sentences, and clear images to highlight key points without overcrowding slides. This helps everyone understand your message easily and stay engaged.
7 Types of Dash Boards
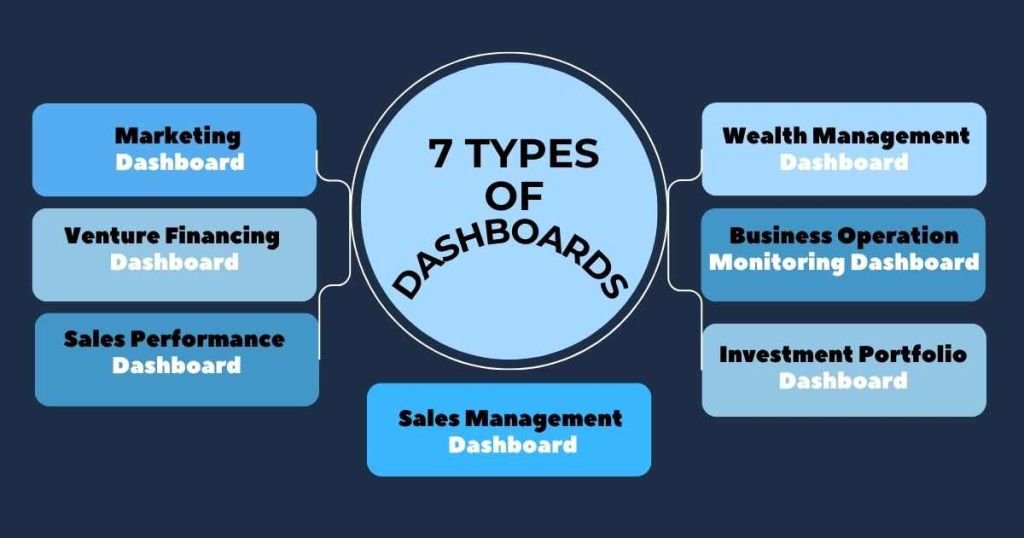
There are numerous charts to use with data-driven maps to build your company’s financial dashboards:
1. Marketing Dashboard
A marketing dashboard is a useful tool that shows both easy-to-measure metrics (like how engaged people are, how many know about your brand, and how they interact with your content) and more complex metrics (like how profitable your campaigns are and their long-term value).
It also includes data from online marketing efforts, such as how many people leave your website quickly, total visits, and how often people click on your ads. Moreover, using a marketing dashboard can bring many advantages to your business.
2. Venture Financing Dashboard
For venture capital investors, having correct and current information about their portfolio companies and investments is very important. However, this helps them make decisions based on data, support their investments better, follow audit rules, and impress their partners who provide funding.
3. Sales Performance Dashboard
In sales, there’s a lot of information to keep track of, like deals won, money earned, lost opportunities, emails sent, and calls made. In addition, to manage a sales team well, you need a system to track these important numbers as they happen and show them in a way that’s easy to understand and looks good.
4. Wealth Management Dashboard
People who have a lot of money are usually in their 40s or 50s, and they’ve earned their wealth over many years. In addition, they often use wealth management services to handle their investments, which give them customized solutions.
Meanwhile, a new group of investors is also earning a lot of money, but they don’t have the right tools to use it wisely. These investors want to see information right away or almost right away, and they want advice that they can act on, based on that information.
5. Business Operation Monitoring Dashboard
This dashboard shows important numbers that help businesses perform better. However, to work well and make decisions fast, operational dashboards should be simple, with only the most important information. This makes it less likely to miss important problems that could cost money.
6. Investment Portfolio Dashboard
An investment portfolio dashboard is a computer program used to manage and review a collection of investments for different business projects. Furthermore, it tracks and measures investment activities using important indicators. The dashboard helps organizations report on how well assets are performing to owners, investors, sponsors, and others involved.
7. Sales Management Dashboard
This shows digital information about how a system or service is performing. It includes key details such as time, battery levels, and GPS location. Additionally, it provides information about sales, giving a comprehensive view of various aspects of the system or service’s operation.
Sharpen Your Financial Edge or Fall Behind
A financial dashboard isn’t just a fancy report—it’s your company’s command center. Ignore it, and you’re flying blind. Use it wisely, and you’ll see problems before they blow up. Think of it like a GPS for your business: clear, updated, and pointing you in the right direction.
Don’t drown in data—highlight what matters. Update often, or your dashboard turns into old news. Keep it simple, or your team will glaze over it instead of taking action.
The bottom line? Smart financial dashboards drive better decisions, sharper strategies, and bigger wins. Those who adapt will thrive—those who don’t will struggle to keep up. Which side will you be on?
FAQs
What is a good financial dashboard example?
A financial dashboard example typically includes key metrics like revenue, expenses, profit margins, and cash flow. It often features real-time data visualizations, such as charts and graphs, to help businesses track financial performance at a glance. Some advanced dashboards also integrate forecasting tools and KPI comparisons for better decision-making.
What are the best financial dashboards for businesses?
The best financial dashboards provide clear insights into financial health with user-friendly layouts and customizable reports. Popular options include Tableau, Power BI, Google Data Studio, and Zoho Analytics. These tools help businesses monitor financial trends, identify risks, and optimize budgeting.
What is dashboard financial reporting?
Dashboard financial reporting is a visual approach to tracking financial performance. Instead of traditional spreadsheets, it presents data in interactive charts, graphs, and KPIs, allowing businesses to quickly analyze revenue, expenses, and profitability.
Which statement regarding a marketing dashboard is most accurate?
The most accurate statement is that a marketing dashboard provides real-time data on marketing performance, helping businesses measure campaign effectiveness, track ROI, and make data-driven decisions. It consolidates key metrics like conversion rates, lead generation, and customer engagement into one view.