
Do you know how companies make data-driven decisions that lead to better outcomes? In every industry, from finance to manufacturing to marketing, turning complex data into actionable insights is important for growth and success. According to Gartner, 90% of companies consider information and analytics essential to their business strategy and success.
Furthermore, over 40% of companies globally use big data analytics, reaping various benefits from big data.
But it’s not just about collecting data—it’s about using the right tools to make sense of it and act on it effectively. Excel models are among the most powerful tools for doing just that.
But first, we must understand what an Excel model is and how it can be used to support better decision-making and drive success.
What is the Use of an Excel Model?
Excel is a top tool for modeling, allowing users to explore real-world scenarios using math, finance, and statistics. It supports econometric models, regression analysis, and VBA programming for complex modeling.
While other software options are specialized for industries or benchmarking, Excel remains a reliable platform for testing models before using advanced software. It combines flexibility, simplicity, and control, enabling users to break down and test calculations and predictions.
For Examples:
- Retail Sales Forecasting: Model the impact of product placement on sales.
- Budgeting and Financial Planning: Forecast revenues and expenses for strategic planning.
- Market Analysis: Use regression tools to analyze relationships between market variables.
- Production Scheduling: Simulate production scenarios to optimize resources and inventory.
- Investment Portfolio Management: Analyze and manage investment strategies and risk.
Important Functions to Master for Excel Modeling
Excel modeling is an important skill for working with data, helping to analyze and make informed decisions. Learning important Excel functions can improve the accuracy and efficiency of your models.
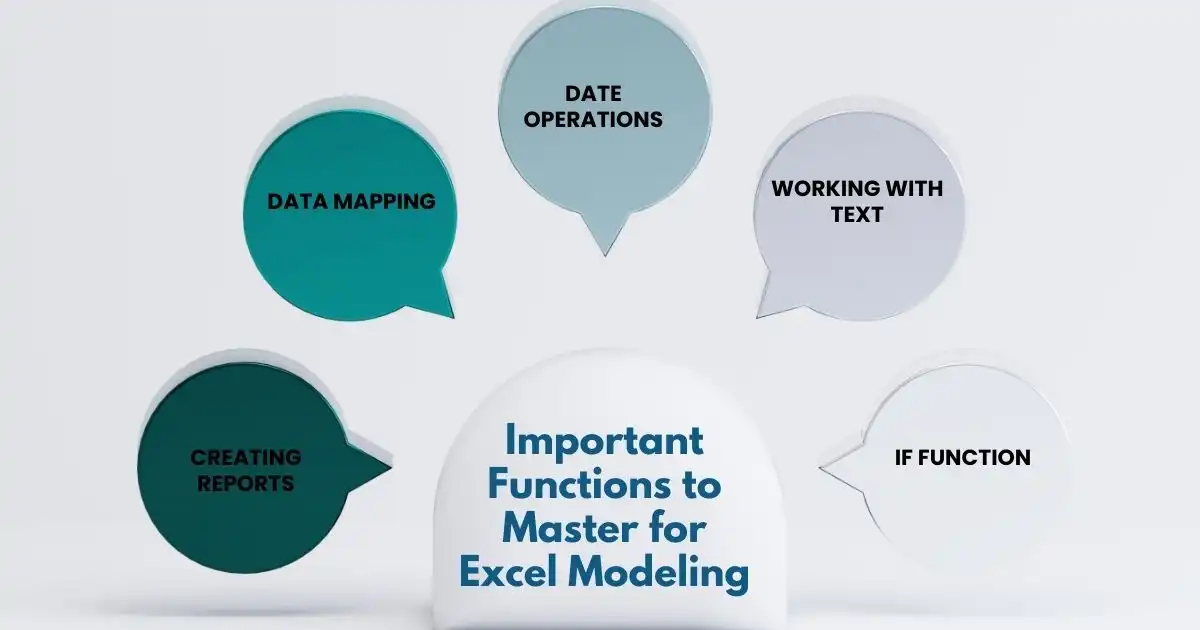
Creating Reports
A major part of a modeler’s job is turning data into meaningful insights. This usually involves creating charts and tables from datasets. The SUMIFS function is helpful here, as it calculates the total value for rows that match specific criteria.
- SUMIFS is part of Excel’s math and trig functions.
- It calculates the total value for rows that meet the given criteria.
- SUMIFS is useful for gathering values needed in reports.
Data Mapping
In modeling, we often need to add details from a reference table to the main dataset. The XLOOKUP function is useful for this, as it moves data between tables using a unique reference. It offers improvements over older functions like VLOOKUP, HLOOKUP, and INDEX MATCH.
- XLOOKUP includes an optional argument for what to return if no match is found, removing the need for error management functions.
- It allows for exact or approximate matches using the match mode argument.
- XLOOKUP lets you specify the search direction, top to bottom or bottom to top, with the search mode argument.
- The dynamic array engine lets XLOOKUP return multiple entries in one formula.
- XLOOKUP is available only to Office 365 users, which may cause compatibility issues.
Date Operations
Modelers often need to adjust dates in Excel. For example, changing a date to the last day of the month is common for reporting. The EOMONTH function is useful in this case.
- The EOMONTH function is part of Excel’s Date/Time functions.
- It returns the serial number for the last day of the current month, adjusted by the specified number of months.
- EOMONTH is often used in financial modeling to move dates between months or to the end of the month.
Formula:
=EOMONTH(Start Date, Months)
- Start Date – The reference date.
- Months – The number of months before (-ve) or after (+ve) the start date.
Working with Text
Working with text is an important skill for modelers. Tasks like cleaning up text, extracting specific parts, or merging text pieces are common. Two important functions for these tasks are TEXTSPLIT and TEXTJOIN.
- TEXTSPLIT divides values into multiple cells using a specified delimiter. It uses Excel’s dynamic array feature to spread results across rows and columns.
- TEXTJOIN combines values from cells or ranges with a delimiter, and offers the option to ignore empty cells. It is an improvement over CONCAT and CONCATENATE.
IF Function
The IF function returns a value based on a True/False test. For example, if the value in cell A1 equals 1, it will show “Yes”; if not, it will show “No.”
Formula:
=IF(A1 = 1, “Yes”, “No”)
Things to consider with the IF function in financial models:
- Excel allows up to 64 nested IF functions, but nesting should be avoided as it can make formulas difficult to understand and maintain.
- Break down formula logic into multiple rows or use the IF function to establish flags (1 or 0).
- Consider using XLOOKUP or INDEX MATCH as clearer alternatives to nested IFs.
- The SWITCH function (introduced in 2016) and the IFS function (introduced in 2019) provide simpler alternatives to nested IFs.
Commonly Used Excel Models by Industry
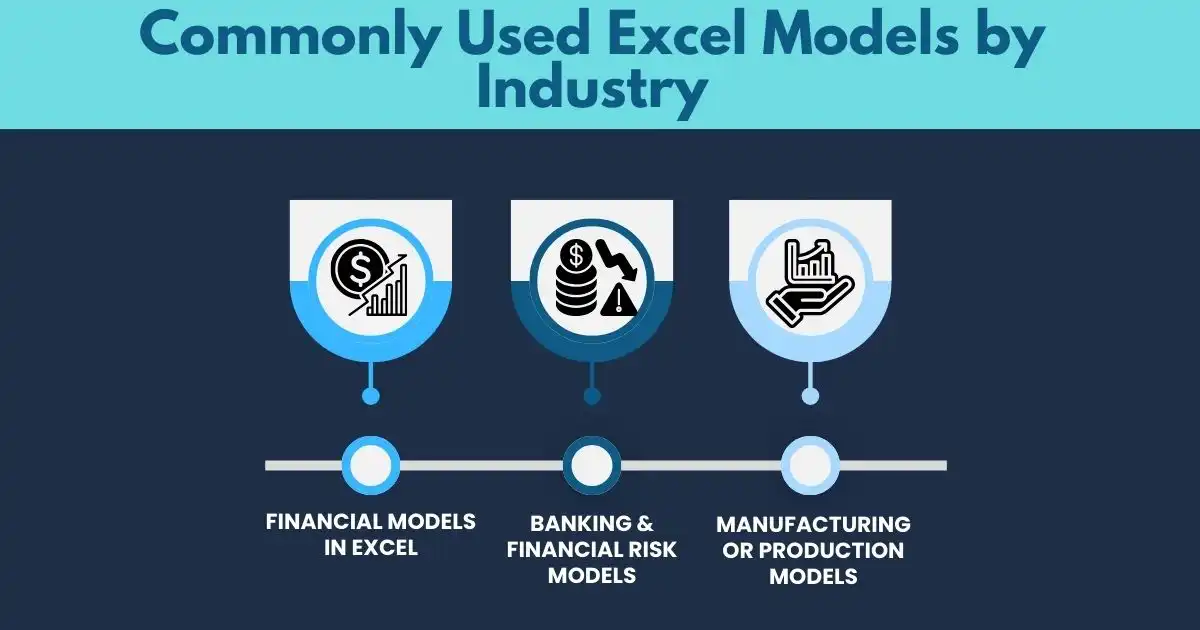
These models are designed to use data from specific market segments or company departments. They can help forecast sales, improve investment ROI, or reduce risk exposure using business intelligence and market insights.
Here are some industry-specific Excel models that are often used:
Financial Models in Excel
Three Commonly Used Financial Models in Excel
- Three-Statement Model
The three-statement model is built by linking the income statement, balance sheet, and cash flow statement using Excel formulas. The entire financial outlook is shaped by assumptions, requiring a strong grasp of accounting, finance, and Excel. - Discounted Cash Flow (DCF) Model
The DCF model is developed by extending the three-statement model to determine a company’s value based on the Net Present Value (NPV) of future cash flows. Cash flows are adjusted, and the XNPV function in Excel is applied to discount them back to present value using the company’s Weighted Average Cost of Capital (WACC). - Merger and Acquisition (M&A) Model
The M&A model is applied to evaluate whether a merger or acquisition will result in increased or decreased earnings. Depending on the complexity of the deal, modifications can be made, making it a commonly utilized tool in investment banking and corporate development.
Banking & Financial Risk Models
Banks use models to manage money and predict demand, but they also rely on risk models to reduce their exposure and ensure they meet capital requirements. Financial institutions also use risk models to manage stock market and investment risks, which can help reduce reliance on in-house systems.
Financial Risk Modeling Process
The financial risk modeling process usually follows these steps:
- Define the risks to be assessed and understand their importance.
- Gather data reflecting risk behavior across different market conditions.
- Select an appropriate modeling methodology based on the model’s objectives and available data.
- Build the model using mathematical and statistical techniques.
- Validate the model by back-testing it with out-of-sample data.
- Analyze the model outputs to assess potential risks under various conditions.
- Continuously update the model to adapt to market changes.
Manufacturing or Production Models
For manufacturing, managing fluctuating costs, product demand, and production pipeline constraints requires detailed planning models. Also, these models often use catalogs of parts stored in Excel or external databases.
Steps to Build a Financial Model for a Manufacturing Business:
- Production Forecast – Start by estimating the number of units to be produced over a specific period.
- Estimate Revenue – Calculate revenue by multiplying sales volume by unit price.
- Cost of Goods Sold Forecast – Project the costs of parts, ingredients, packaging, and shipping for the final product.
- Compute Expenses – Estimate operating expenses like marketing, rent, and salaries.
- Profit and Loss Report and Cash Flow – Prepare a profit and loss statement and a cash flow statement to track financial performance and funding needs.
Understanding these steps is important for building an effective financial model to support your manufacturing business’s growth and sustainability.
Convert Your Data into Actionable Insights Using Excel
In a world that keeps changing, using the right tools to understand data is important. Excel models can turn raw data into real, actionable insights that drive success. you’re forecasting sales, managing budgets, or planning investments, Excel is a tool you can count on to tackle complex scenarios.
But the real value comes not just from using Excel, but knowing how to use it effectively. Functions like SUMIFS, XLOOKUP, and EOMONTH help you create models that break down critical information, making it easier to make smarter decisions. Excel’s flexibility gives you control, helping you predict the future and avoid costly mistakes.
Remember, data isn’t just numbers on a page—it’s a roadmap. With the right Excel model in hand, you can make decisions that guide your business in the right direction. Don’t let the data overwhelm you—use it to your advantage and act today.
FAQs
What are some examples of spreadsheet models?
Examples of spreadsheet models include sales forecasting, financial planning, production scheduling, and market analysis. Also, these models use data to make predictions, plan strategies, and optimize decision-making in different business areas.
How can I get started with data modeling with Microsoft Excel?
Data modeling with Microsoft Excel begins by organizing data into structured tables and using functions like SUMIFS, XLOOKUP, and EOMONTH to analyze and manipulate the data. Additionally, Excel allows you to test different scenarios and predict outcomes through simple yet powerful models.
What are the different types of spreadsheet models?
Types of spreadsheet models include financial models, budgeting models, sales forecasts, and production schedules. Also, each model serves a specific purpose and helps businesses analyze data to make informed decisions. Excel provides the tools to build and refine these models efficiently.
Why is Excel important in business?
Excel is important in business because it provides a versatile and powerful tool for managing, analyzing, and visualizing data. It helps businesses make informed decisions by organizing financial information, tracking sales, budgeting, and forecasting future trends.
Additionally, Excel’s ability to handle complex calculations, create models, and generate reports makes it a vital resource for businesses of all sizes.