
According to a 2023 survey by CFA Institute, 87% of investment professionals consider income statement analysis important for evaluating a company’s financial health.
As a professional, business owner, entrepreneur, or investor, knowing how to read and understand an income statement is an important skill. This important financial document helps you see your company’s current financial health, predict future opportunities, decide on business strategies, and set meaningful goals for your team.
Even if you don’t have a background in finance or accounting, learning to understand financial statements like the income statement can greatly benefit your career. It may seem challenging at first, but taking the time to learn will pay off in the long run.
What is an Income Statement?
The income statement, also known as the profit and loss (P&L) statement, shows a company’s revenues, expenses, and net income for a specific time period. It is a key financial document that every organization closely examines. Even though it seems straightforward, it provides important insights.
This income and expense statement summarizes all revenue, gains, expenses, and losses within a period, typically issued quarterly and annually. Moreover, it helps identify financial trends and make comparisons over time. Understanding this statement is essential for assessing past performance and predicting the future, enabling informed decisions.
Structure of an Income Statement
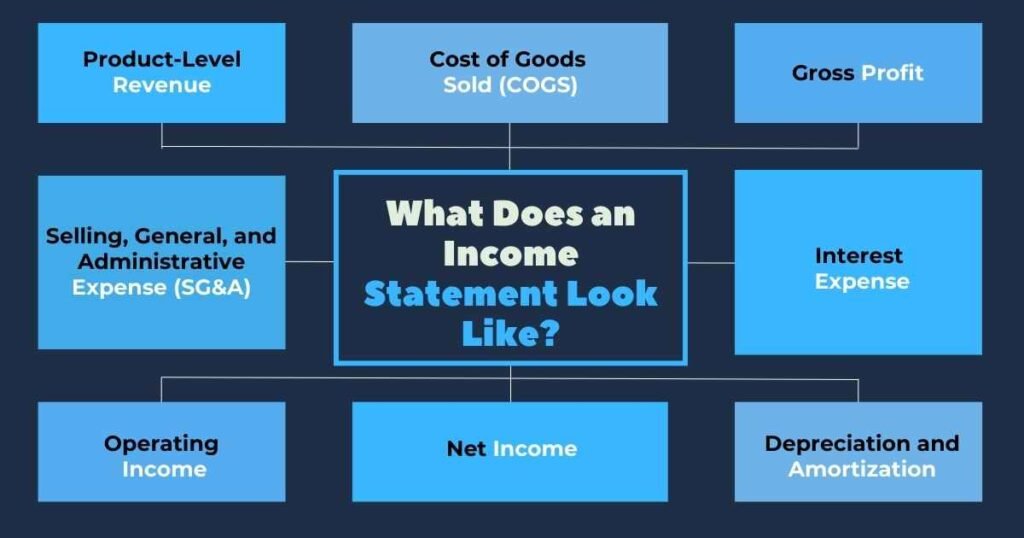
Although income statements look different, they all include key data: total revenue, total expenses, and net income. These basics are essential, but more details are often given to explain the company’s financial activities better. Common items and their typical order are:
1. Product-Level Revenue
This shows the money earned from selling specific products. If the company sells many products, each product’s revenue is listed separately. This helps identify which products are the most profitable and which may need more marketing or development efforts.
2. Cost of Goods Sold (COGS)
This shows the direct costs of making the products, like raw materials, labor, and manufacturing expenses. For example, a paper mill includes the cost of pulp in COGS. Understanding COGS helps the company determine pricing strategies and manage production costs.
3. Gross Profit
This is the revenue left after subtracting COGS. It shows the money available to run the business and pay stakeholders. Gross profit is an important indicator of a company’s efficiency in producing and selling its goods.
4. Selling, General, and Administrative Expense (SG&A)
This includes all costs related to selling products and running the company. It covers expenses such as salaries, office supplies, marketing, and administrative costs. SG&A is important for understanding the overhead costs of the business and managing operational efficiency.
5. Interest Expense
This shows the interest payments the company made to finance its operations during the period. It includes interest on loans and other debt instruments. Monitoring interest expense helps in managing debt levels and financial health, ensuring that the company can meet its financing obligations.
6. Operating Income
Operating income is the profit from regular business operations, calculated by subtracting SG&A expenses from gross profit. It shows how well the company handles its core activities, excluding non-operational income and expenses like interest and taxes.
High operating income indicates strong performance in production, sales, and administration, while low operating income may signal inefficiencies. This metric helps managers and investors make informed decisions about strategies and investments.
7. Net Income
Net income is the total profit after all expenses, including interest and taxes, have been deducted from total revenue. It provides a clear picture of the company’s profitability and is important for assessing management effectiveness and operational efficiency. This metric influences decisions on dividends, reinvestment, and expansion plans.
For investors, net income is key to evaluating returns and comparing the financial health of different companies.
8. Depreciation and Amortization
These are non-cash expenses that account for the reduction in value of tangible and intangible assets over time. Including these helps in understanding the long-term investment in the company’s assets.
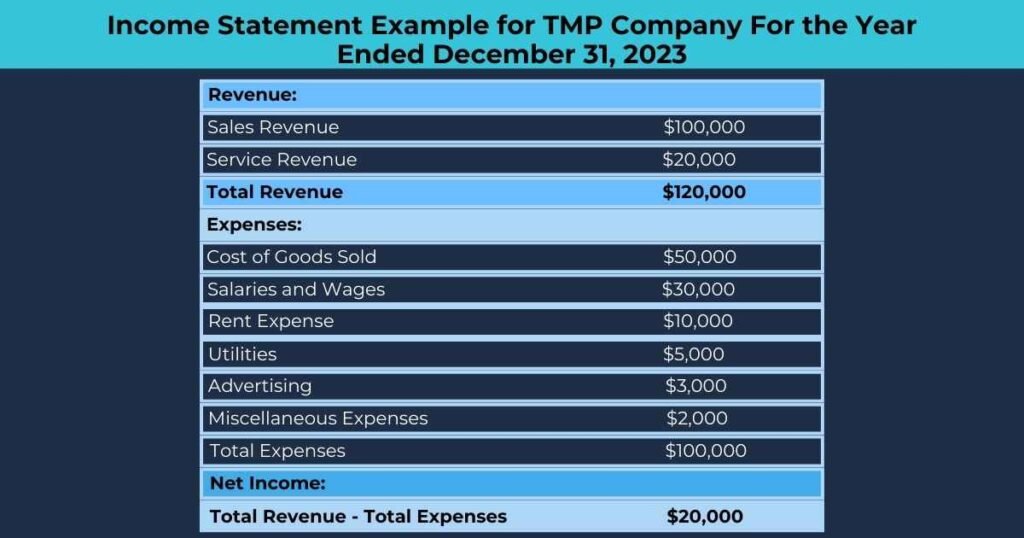
Here’s what an income statement typically looks like:
What’s the Purpose of an Income Statement?

The purpose of an income statement is to show how well a company is doing financially over a specific period. Moreover, it tells the story of a business’s operating activities. In an income statement, you’ll see all the revenue and expenses for a set time frame. Additionally, accountants create income statements using trial balances from two different dates.
By looking at an income statement, or income report, along with other financial documents like the cash flow statement, balance sheet, and annual report, you can see if the business is making money, spending more than it earns when costs are highest and lowest, how much it costs to make its product, and if it has the cash to reinvest in the business.
Accountants, investors, and business owners often check income reports to understand how well a business is doing compared to its expected performance. This helps them make decisions. For example, a business owner might change their strategy if the company isn’t meeting targets, or an investor might sell shares in a company that’s underperforming and buy shares in one that’s doing well.
The Importance of an Income Statement
Income statements, along with the cash flow statement, balance sheet, and annual report, help company leaders, analysts, and investors get a complete picture of a business’s performance. This helps them understand its value, efficiency, and potential future direction.
By analyzing an income statement, you can see trends like decreasing costs of goods sold, increasing sales, and rising return on equity. Businesses also use income statements to identify ways to cut costs or plan for growth.
Knowing how to read and understand an income statement helps you make better decisions about a company, be it your own, your employer’s, or a potential investment.
Final Thoughts
The income statement, or profit and loss (P&L) statement, is a key financial document that shows an organization’s financial health. Moreover, it details a company’s revenue, expenses, and net income over a certain period. Understanding the income statement format helps evaluate past financial performance and predict future outcomes.
Automating P&L statements and examining key metrics like revenue growth, gross profit margin, and net profit margin can help investors make informed decisions, especially when comparing companies in the same industry. These insights are valuable not only for investors but also for management and stakeholders, helping them make smart, strategic choices to ensure the company’s financial stability and success.
FAQs
What are the key components of an income statement?
An income statement consists of several key components: revenue (or sales), cost of goods sold (COGS), gross profit, operating expenses, operating income, non-operating income and expenses, and net income. Furthermore, understanding these components helps to get a clear picture of a company’s financial performance.
How do I interpret the gross profit margin?
The gross profit margin is found by dividing gross profit by revenue and then multiplying by 100. Moreover, it shows the percentage of revenue left after paying for the cost of goods sold. A higher gross profit margin indicates that a company is efficient in producing its goods or services compared to its revenue.
Why is the net profit margin important?
The net profit margin is the percentage of revenue remaining after all expenses are deducted from sales. To calculate it, divide net income by revenue and multiply by 100. This metric is important because it shows how well a company can convert revenue into actual profit, reflecting overall profitability.
How can I use the income statement to assess a company’s financial health?
To assess a company’s financial health, look at trends in revenue, gross profit, operating income, and net income over multiple periods. However, consistent growth in these areas indicates good financial health. Additionally, comparing these metrics with industry peers can provide insights into the company’s competitive position.