Figuring out if your company is on the right path can feel like trying to find your way through thick fog.
Without clear signs, it’s easy to lose focus and drift away from your goals. That’s where Key Performance Indicators (KPIs) come in—they work like a compass, pointing you toward success. By tracking the right KPIs, you can see exactly how your business is doing and make smart decisions that keep you on track.
What are Key Performance Indicators (KPIs)?

KPIs, or Key Performance Indicators, are measurable values that show how well a business is reaching its main goals. These goals could be increasing sales, improving customer satisfaction, or making operations more efficient. KPIs help businesses track progress, spot improvement areas, and make better decisions.
For example, a company that wants to boost revenue might track KPIs like sales growth or profit margins. They might look at customer retention rates or feedback scores if customer satisfaction is the focus. Regularly checking these metrics, businesses can see what’s working and where they need to make changes, helping them stay on course.
The Importance of KPIs in Business

Having clear KPIs is important for several reasons. First, they help you evaluate how your business is currently doing and spot areas that need improvement. Focusing on specific metrics, you can identify weaknesses and take action to improve overall performance. Finding slowdowns in your production process or fixing customer service issues, KPIs give you the insights needed for continuous improvement.
KPIs also help you set realistic goals and measure your success over time. Using past data as a baseline, you can track your progress and see if you’re moving in the right direction. This helps keep you on course and provides a benchmark for setting future goals.
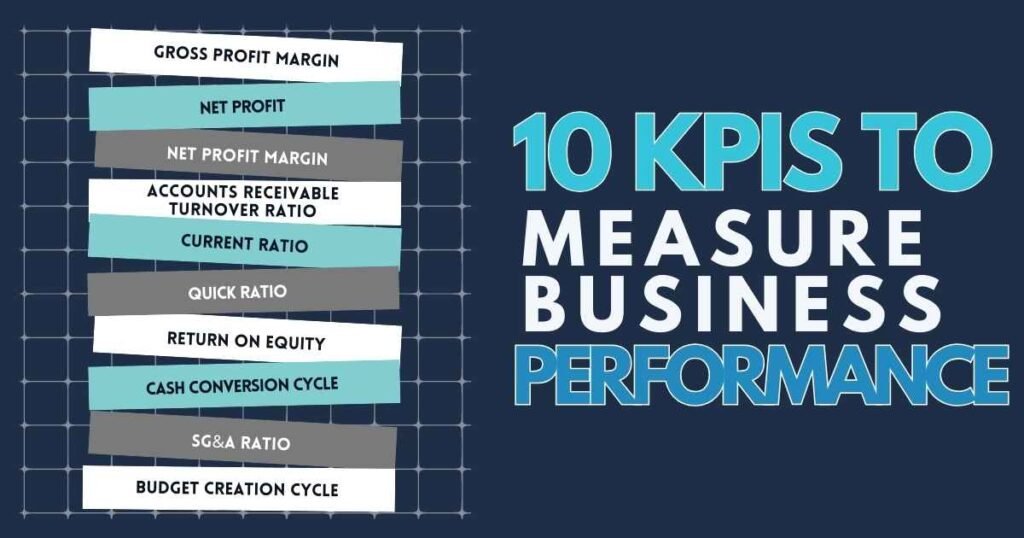
10 KPIs to Measure Business Success

These KPIs show progress in areas like sales, customer satisfaction, and financial health. Understanding these metrics, businesses can make better decisions, set goals, and improve overall performance.
1. Gross Profit Margin
Gross profit margin shows how much profit you make after subtracting the cost of goods sold (COGS). It indicates how efficiently your business produces and sells products. A good margin means you’re covering direct costs and still making enough to cover fixed expenses like rent and salaries. Monitoring this margin helps you spot trends, adjust prices, and ensure profitability.
Calculation: (Revenue -COGS) ÷ Revenue ×100%
2. Net Profit
Net profit is the money left after all expenses, including materials, labor, rent, and taxes. Also called net income, it shows your business’s true profit and financial health. A positive net profit means your business is making money; a negative one means it’s losing money. Investors and stakeholders closely watch this key measure of performance.
Calculation: Total Revenue−Total Expenses=Net Profit
3. Net Profit Margin
Net profit margin shows how much of your revenue becomes profit after expenses like production, operating costs, taxes, and interest. A higher margin means your business is more efficient and profitable. It’s a key metric for tracking profitability and comparing with competitors to find areas for cost control.
Calculation: (Total Revenue – Total Expenses) ÷ Total Revenue ×100%
4. Accounts Receivable Turnover Ratio
This ratio, known as the Receivables Turnover Ratio, shows how well your business collects cash from credit sales. A higher ratio means customers are paying their invoices quickly, which is great for cash flow.
It helps ensure your business has enough money on hand to cover expenses and invest in growth. A lower ratio might indicate issues with collecting payments, which could hurt your cash flow.
Calculation: Net Credit Sales ÷ Average Accounts Receivable = Turnover Ratio
5. Current Ratio (Working Capital Ratio)
The current ratio measures your ability to pay off short-term debts with your current assets. For example, if your current assets are $30,000 and your current liabilities are $15,000, your current ratio is 2, meaning you have $2 in assets for every $1 of debt. This ratio is also used by creditors to assess the risk of lending to you.
Calculation: Current Assets ÷ Current Liabilities = Current Ratio
6. Quick Ratio (Acid Test Ratio)
The quick ratio shows how well you can pay off short-term debts without relying on selling inventory. For example, if your current assets are $25,000, inventories are $5,000, and current liabilities are $15,000, your quick ratio is 1.33. This ratio gives a more accurate picture of your immediate liquidity.
Calculation: Current Assets – Inventories ÷ Current Liabilities = Quick Ratio
7. Return on Equity (ROE)
ROE measures how efficiently you generate profit from shareholders’ investments. For instance, if your net income is $10,000 and your shareholder equity is $50,000, your ROE is 20%. This tells you how much profit you earn for every dollar invested by shareholders.
Calculation: Net Income ÷ Shareholder Equity = ROE
8. Cash Conversion Cycle (CCC)
CCC measures how quickly your company turns its investments in inventory into cash. A shorter cycle is better, as it means you’re selling inventory and collecting payments quickly. For example, if your days inventory outstanding is 30, days sales outstanding is 20, and days payable outstanding is 10, your CCC is 40 days.
Calculation: Days Inventory Outstanding + Days Sales Outstanding – Days Payable Outstanding= CCC
9. SG&A Ratio
This ratio shows the percentage of your revenue spent on selling, general, and administrative expenses. For example, if your SG&A expenses are $5,000 and your total sales are $50,000, your SG&A ratio is 10%. A lower ratio indicates better cost management.
Calculation: SG&A Expenses ÷ Total Sales = SG&A Ratio
10. Budget Creation Cycle
The budget creation cycle tracks how long it takes to prepare, approve, and implement a budget. For example, if it takes you 20 days to complete this process, this cycle helps you understand how well you know your business and manage your finances.
Calculation: Days to Prepare, Approve, and Implement Budget = Budget Creation Cycle
The Importance of Using Financial Software to Track KPIs
Beyond common financial metrics, businesses often track specialized indicators like inventory levels, sales, receivables, payables, and human resources. Calculating these metrics manually can be time-consuming and prone to errors. To simplify this, many businesses use financial software to automate the tracking process and consolidate all key data into one dashboard.
For instance, a retail store might use software to monitor inventory turnover, sales per square foot, and customer return rates. Accounting and financial management software typically includes real-time dashboards with KPIs tailored to specific roles and industries.
Users can easily customize these dashboards to add KPIs that align with their unique goals. As the software processes transactions and financial data, the dashboards automatically update, providing a clear and up-to-date picture of business performance without the need for manual calculations.
Track the Right KPIs
Financial KPIs and metrics are essential for helping leaders and employees keep track of company performance and monitor important changes over time. They help you set clear goals and ensure everyone is working towards the same objectives. With financial software that provides real-time, automated KPIs, you can focus on what really matters without getting overwhelmed by unnecessary data.
Are you consistently tracking the right KPIs to make sure your business is on the right path? Remember, the smallest details can make the biggest difference—are you paying attention to the numbers that really count?
FAQs
What are KPIs?
KPIs, or Key Performance Indicators, are specific numbers or measurements that help you see how well your business is doing in key areas. For example, KPIs can track things like how much your sales are growing, how satisfied your customers are, or how efficiently your business is running. They give you a clear way to measure success and identify where improvements are needed.
Why are KPIs important for business success?
KPIs are important because they give you a clear picture of how your business is performing. Tracking KPIs, you can see if you’re meeting your goals, spot problems early, and make better decisions. For example, if a KPI shows that customer satisfaction is dropping, you can take steps to improve it before it impacts your sales.
Which KPIs should I focus on?
The KPIs you focus on should match your business goals. If your goal is to increase revenue, you might focus on sales growth and profit margins. If customer satisfaction is your priority, KPIs like customer retention and Net Promoter Score (NPS) would be important. The right KPIs depend on what you want to achieve.
How often should I review my KPIs?
Reviewing your KPIs regularly—weekly, monthly, or even daily—helps you stay on top of your business’s performance. Regular checks allow you to make timely adjustments if something isn’t working. For example, if your sales growth KPI shows a decline, you can quickly investigate and address the issue before it worsens.
